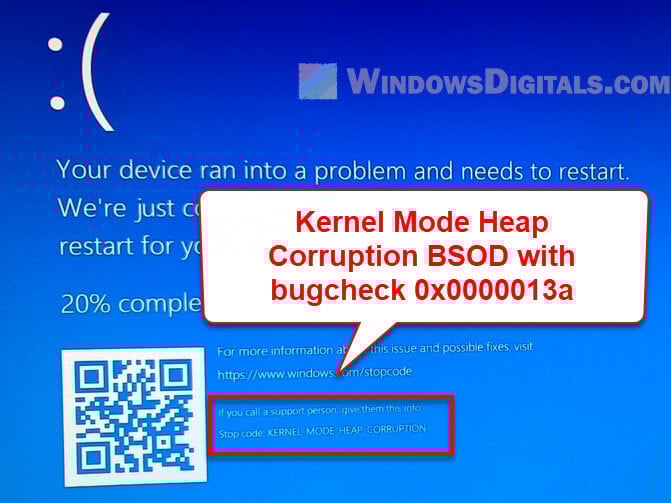
Few things make you worry like seeing a “Blue Screen of Death” (BSOD) pop up, especially on a Windows computer. It gets more confusing when the screen is filled with complicated error codes. A common blue screen STOP code that you might encounter is the 0x0000013a: Kernel_Mode_Heap_Corruption.
This tells us there’s a big problem with the memory because something’s gone wrong in a specific area where the operating system and some drivers go to grab memory. In this guide, we’re going to talk about what Kernel_Mode_Heap_Corruption and its error code 0x0000013a mean, why they happen, and how you can fix it.
Also see: Stop Code Kernel_Data_Inpage_Error BSOD in Windows 11/10
Page Contents
What is the 0x0000013a Kernel Mode Heap Corruption BSOD error?
Let’s first get a clear picture of what this error actually means.
What’s the Kernel-Mode Heap?
The kernel-mode heap is a special memory spot for the operating system’s brain and some drivers. It’s very important and works at a high security level, which means if something goes wrong here, it’s going to be a big problem. Think of the heap as a memory pool where the system picks up memory for important tasks.
Learn more: What does a Blue Screen with Sad Face mean on Windows 10/11
Why is corruption a problem?
When the kernel-mode heap gets messed up, it means someone or something messed with the memory in a bad way. This can make your computer crash or show the dreaded BSOD. Because this heap is so crucial, even a small mistake can cause big problems.
What actually causes the 0x0000013a error?
- Problems with RAM or other parts can mess up the memory. This is a common reason for these errors.
- Drivers that don’t play nice can accidentally wreck the heap.
- Bad software might attack this area, causing trouble.
- Some programs, especially those that need special access, might have issues that lead to corruption.
- Pushing your computer too hard (overclocking) can cause all sorts of chaos, including memory problems.
Linked issue: Windows 11/10 Computer Blue Screen When Idle (Fix)
How to fix the bugcheck 0x0000013a blue screen error
If you’re facing the 0x0000013a: Kernel_Mode_Heap_Corruption error, here are some steps to help you figure out and fix the problem.
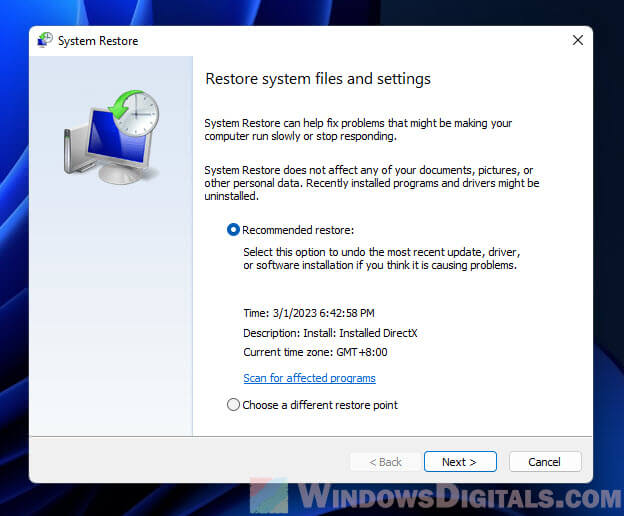
System Restore
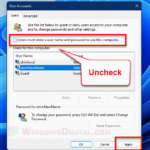
If you’ve just added new software, drivers, or updates, going back to how things were using System Restore before might fix it.
- Hit the “Start” button.
- Type “System Restore” and pick a date you want to restore your PC back to.
- Follow the the rest of the on-screen instructions to complete the process.
Check for hardware issues
Memory problems are often to blame. Try using a tool like “Windows Memory Diagnostic” to check your memory.
- Click on the “Start” button.
- Type “Windows Memory Diagnostic” and click on what shows up.

- Pick “Restart now and check for problems” to have your computer look for memory issues.
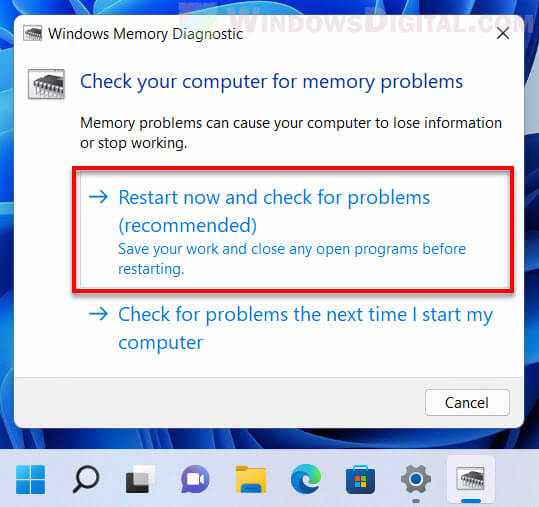
If it finds issues, you might need to replace the bad RAM stick.
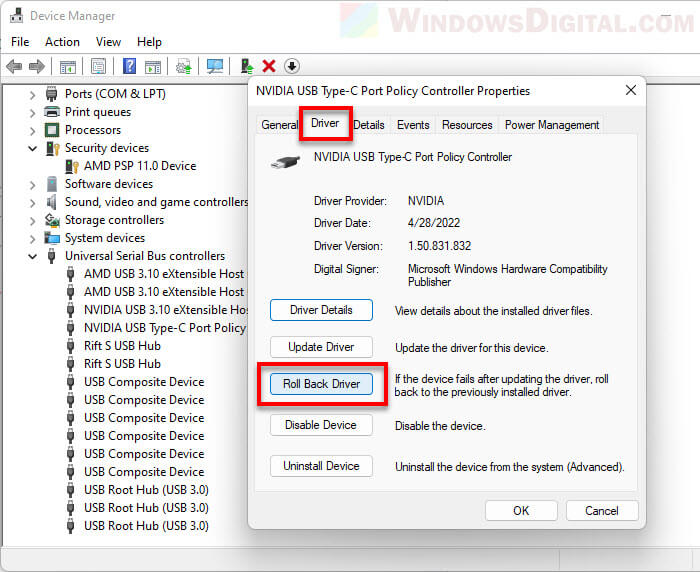
Update or roll back drivers
Bad drivers can also be the root of the problem.
- Right-click the “Start” button and go to “Device Manager”.
- Look for any devices marked with a yellow triangle.
- Right-click the troublemaker and either update or roll back its driver, depending on when the problem started.
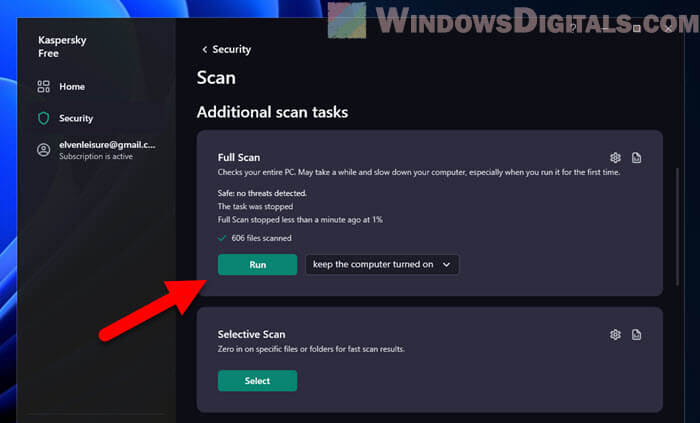
Scan for malware
Make sure no viruses are messing things up. Try to run a full system scan with a good antivirus software or just Windows Defender.
- Open your antivirus.
- Do a “Full Scan” or “Complete System Scan”.
- Get rid of any bad stuff it finds and reboot your computer.
Pro tip: How to Scan an .exe File for Viruses to Check If It’s Safe
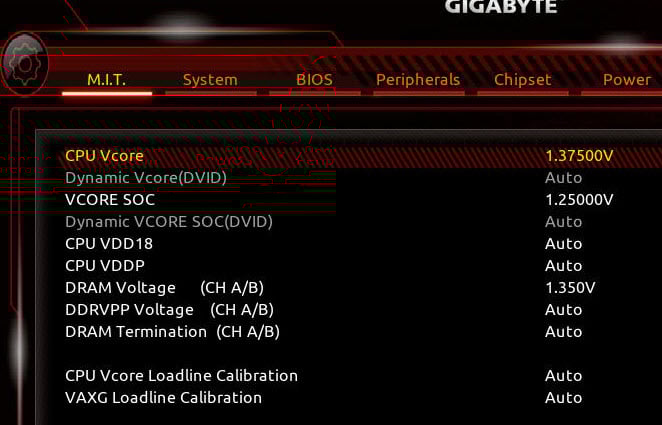
Avoid overclocking
If you’ve been pushing your computer’s speed beyond its normal limits by what we call overclocking (usually the CPU, RAM and GPU), it might be time to try setting them back to stock (default) clocks to avoid crashes and errors.
Further reading: Why is my CPU Overheating and How to Fix it
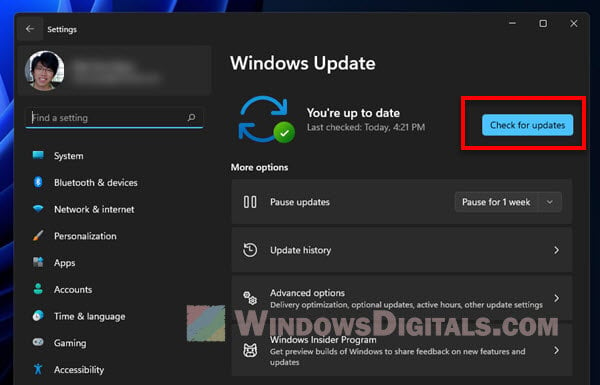
Update Windows
Keeping Windows up to date can fix a bunch of issues when there are any known bugs in the OS, including this one.
- Click the “Start” button.
- Go to “Settings”.
- Hit “Windows Update”.
- Check for any updates.
Try these fixes and see if the blue screen stops popping up. If it keeps happening, you might need to dig deeper with some expert help or consider a fresh Windows install.
Figure out the cause with the dump file
One of the best ways to find out why you’re seeing the 0x0000013a: Kernel_Mode_Heap_Corruption error is by looking at the dump file. This file captures what was going on when the crash happened and can give clues to what actually caused it.
See also: Windows 11 Dump File Location
How to use WinDbg to check the dump file
WinDbg is a tool from Microsoft for figuring out problems with Windows. Below is how to use it:
- Download WinDbg from Microsoft’s site.
- Install it on your computer.

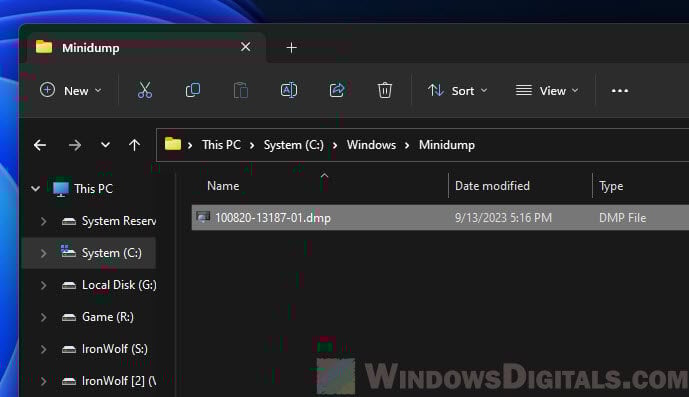
- Windows usually keeps dump files at
C:\Windows\Minidump. - Remember this location because you’ll need it in WinDbg.
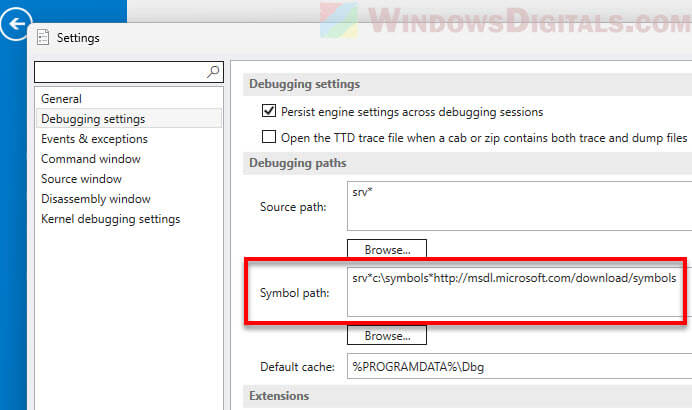
- Symbols help make sense of the dump file’s code. Open WinDbg and go to the settings to set the symbol path to get symbols from Microsoft and save them locally.
- In WinDbg, open the dump file from
C:\Windows\Minidump.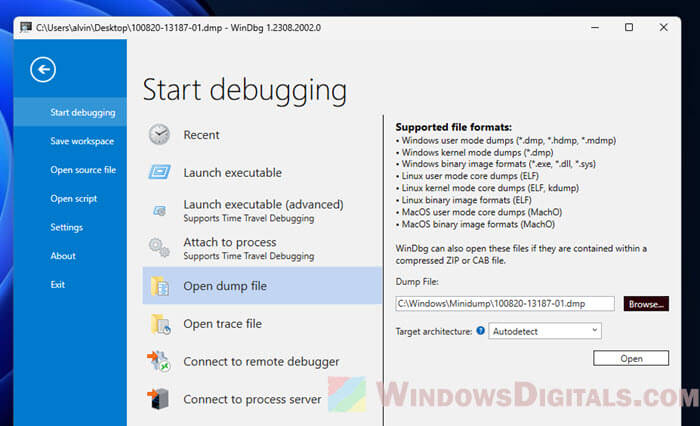
- Type
!analyze -vin WinDbg to start the analysis. It might take a few minutes.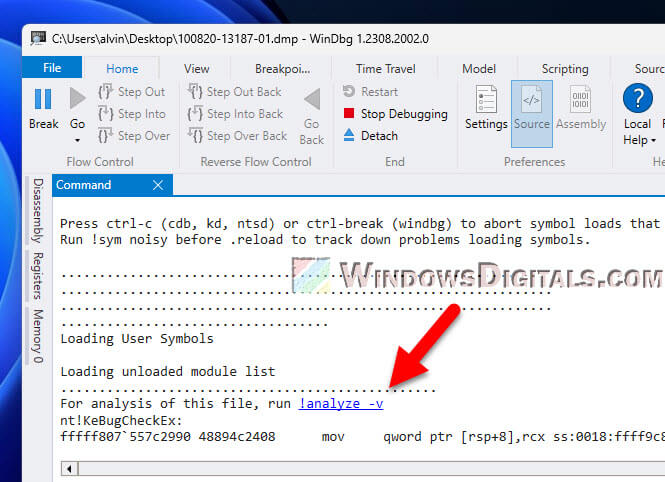
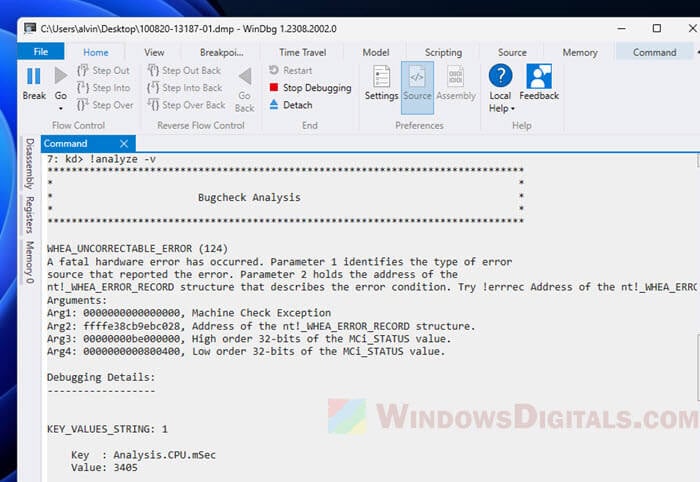
- WinDbg will show details about the error, like which driver or software might be at fault.
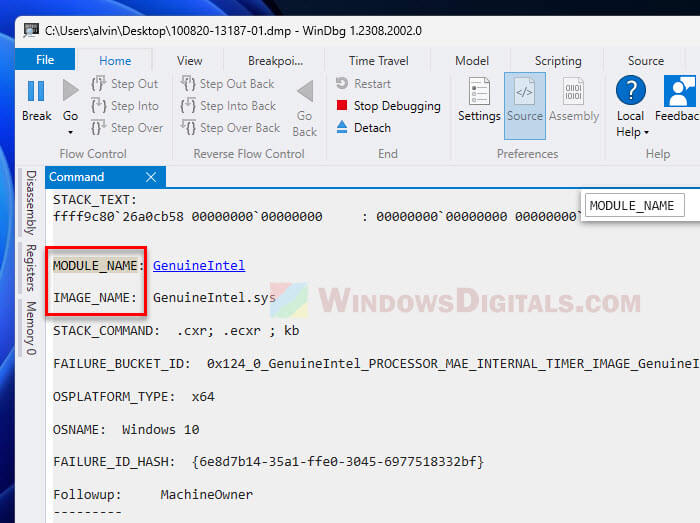
- If you find a culprit, try updating, reinstalling, or getting rid of it to see if that fixes the problem.
- If you’re still stuck, asking for help from a pro or checking online forums might give you more ideas.
Related resource: Dump file creation failed due to error in Windows 11
Analyzing dump files can be quite difficult and complicated, but with some practice, you can figure out the cause of any blue screen errors you might encounter in the future.